MapArt: Collaborative Real-Time Painting Web App
Client: MapArt
Project Details
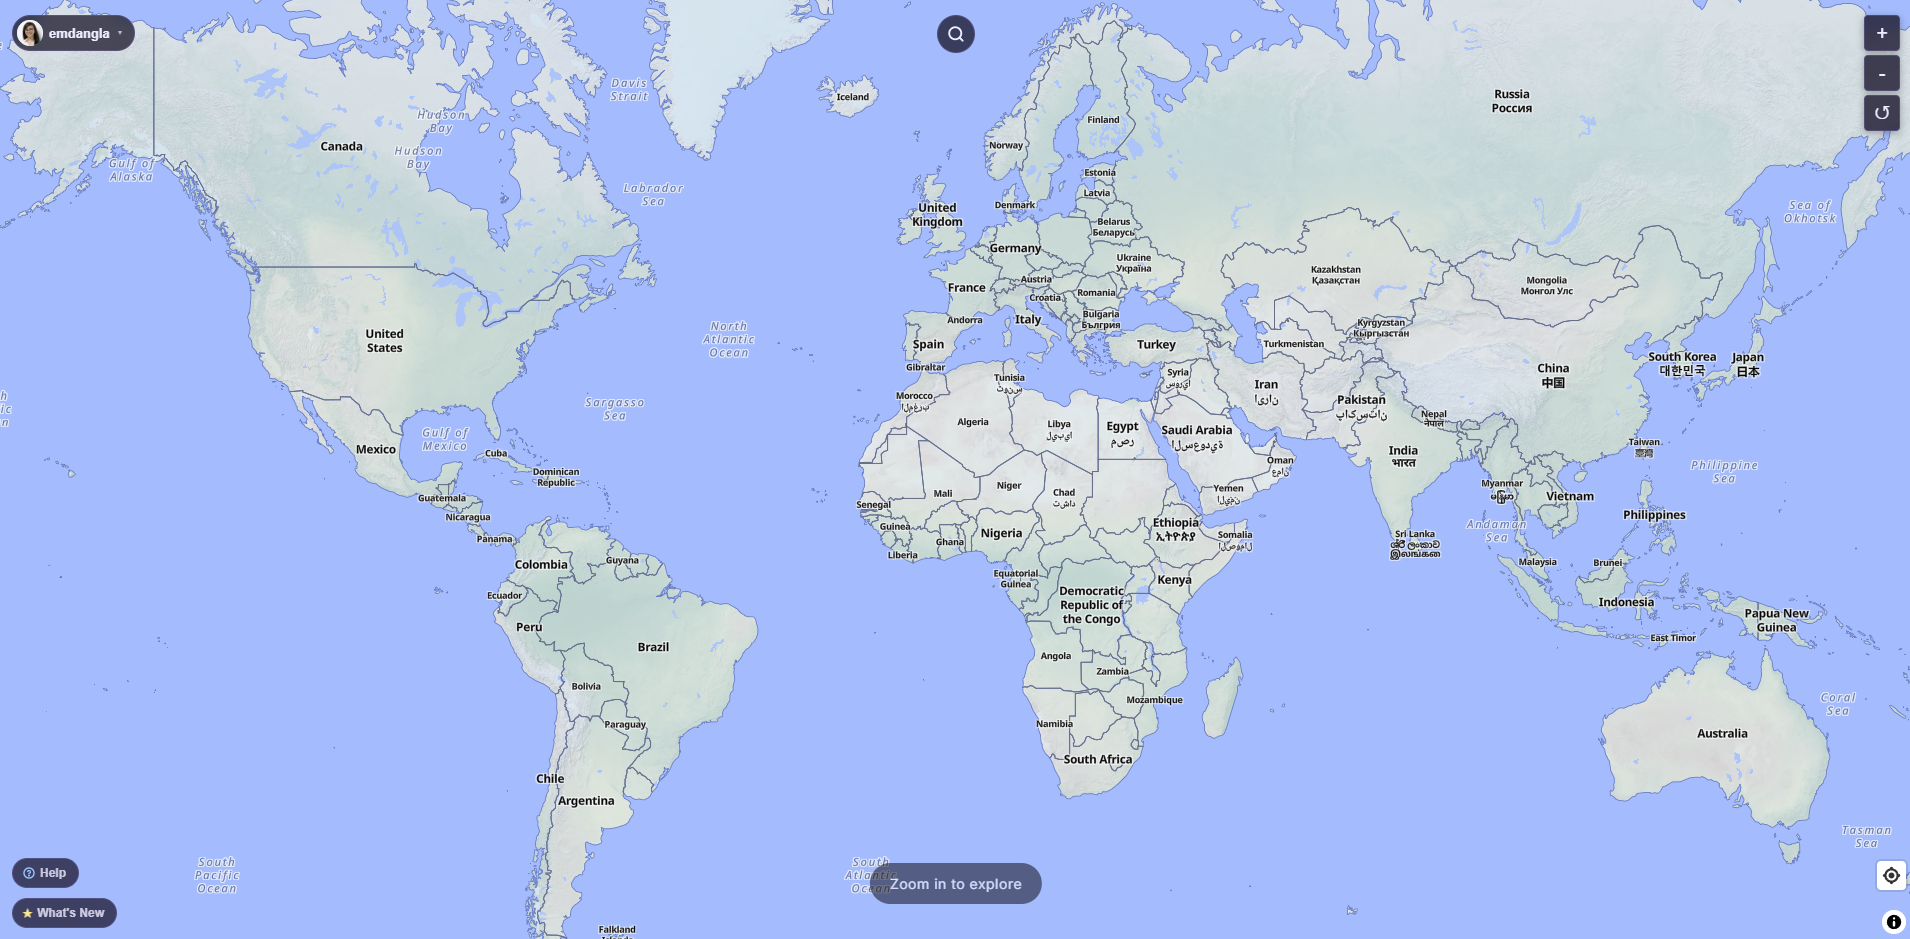
MapArt is a real-time collaborative painting game on an interactive world map. Players click into any country, paint alongside others with freeform brush strokes, and compete for leaderboard dominance through a gamified energy and progression system. I co-founded MapArt with my son Shan (age 12), who serves as co-founder and Gen Alpha product lead. I lead the product, architecture, and development end to end. The app is live and playable at mapart.live while development continues.
Challenge
The core challenge: build a real-time collaborative canvas that feels responsive and smooth on both desktop and mobile, without the infrastructure budget of a funded startup. The target audience (Gen Z and Gen Alpha) is unforgiving - laggy strokes, clunky UX, or a slow map kills the session. Every decision has to serve two constraints: real-time performance and near-zero operating cost at launch.
Product Strategy
Before writing application code, I defined the MVP scope and the success metrics that would tell me whether the product is working. The MVP is structured in two phases: Phase 1 covers the core engagement loop (map, painting, energy system, auth), Phase 2 adds competitive and social mechanics (leaderboards, progression, presence, moderation). I explicitly deferred 20+ features - guilds, in-game currency, a store, paint battles, mobile apps - to avoid scope creep before validating the core loop.
Success targets are defined across retention, strokes per session, and average session length, and these directly shaped the analytics dashboards I built in PostHog.
How I Built It
The stack is purpose-built for real-time, multi-user state at minimal cost. React 18 + TypeScript on Vite for the frontend, deployed on Vercel. The interactive world map runs on MapLibre GL JS, and canvas rendering uses the HTML5 Canvas 2D API directly for full control over brush feel and performance. The backend is Node.js + Express on Railway (one of the few platforms supporting persistent WebSocket connections affordably), with Socket.io managing per-country rooms so stroke events only broadcast to users in the same canvas. Supabase PostgreSQL handles persistent data, Upstash Redis handles real-time ephemeral state, and Cloudflare R2 stores periodic canvas snapshots.
A few problems were particularly interesting to solve:
- Canvas rendering at scale. Thousands of strokes can't be redrawn from scratch on every load. I built a snapshot system that periodically bakes all strokes into a flat PNG per country. On load, the client fetches the latest snapshot, then renders only newer strokes on top.
- Mobile touch drawing. The canvas handles mouse, stylus, and touch simultaneously. Single-finger touch draws, two-finger gestures pan and zoom. Custom touch event handlers disambiguate gestures before they reach the map or canvas layers.
- Energy system fairness. Energy cost scales with stroke length, not count. This prevents both spam (rapid short clicks) and griefing (massive strokes covering the canvas) while rewarding deliberate artistic input.
What's Live
- Interactive world map with clickable, zoomable country canvases
- Real-time brush painting with variable size, 20+ colors, eraser, undo/redo
- Energy system with regeneration and level-up capacity increases
- Leaderboards (country and player, with today/week/all-time filters)
- Real-time presence indicators per country
- Country search, geolocation, and random country discovery
- User profiles with avatar upload, level tracking, and stroke counts
- Admin dashboard and in-app moderation
- Staging environment running parallel to production
Analytics
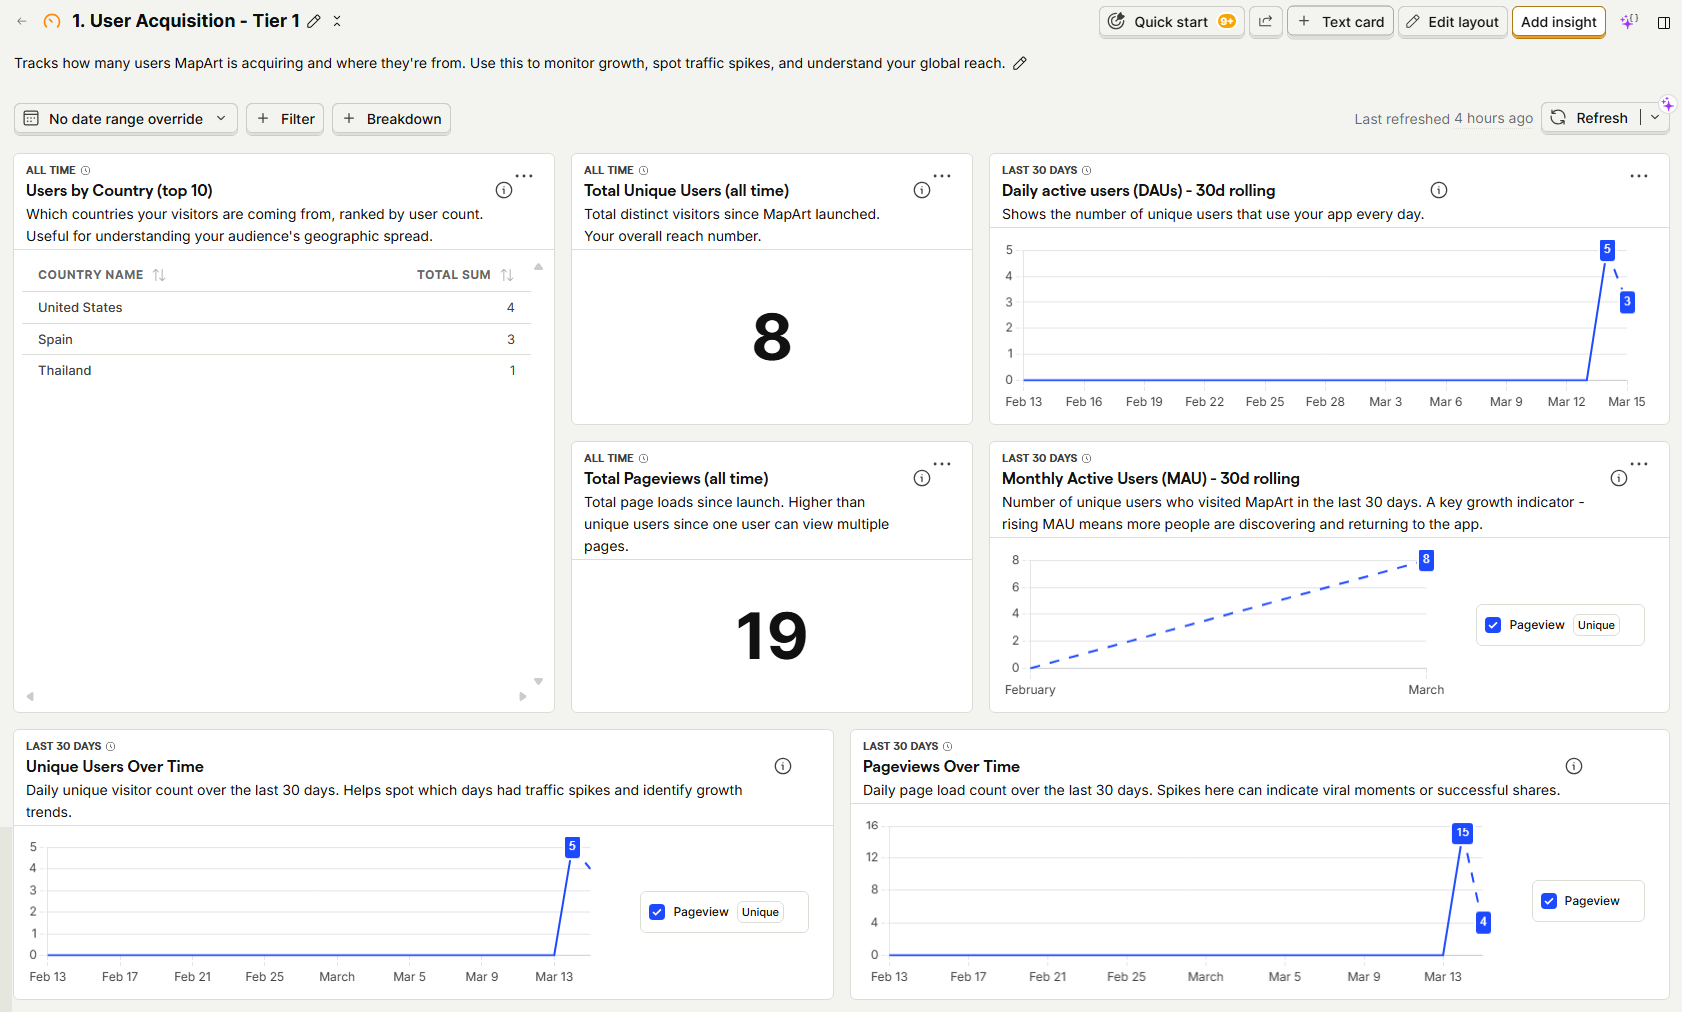
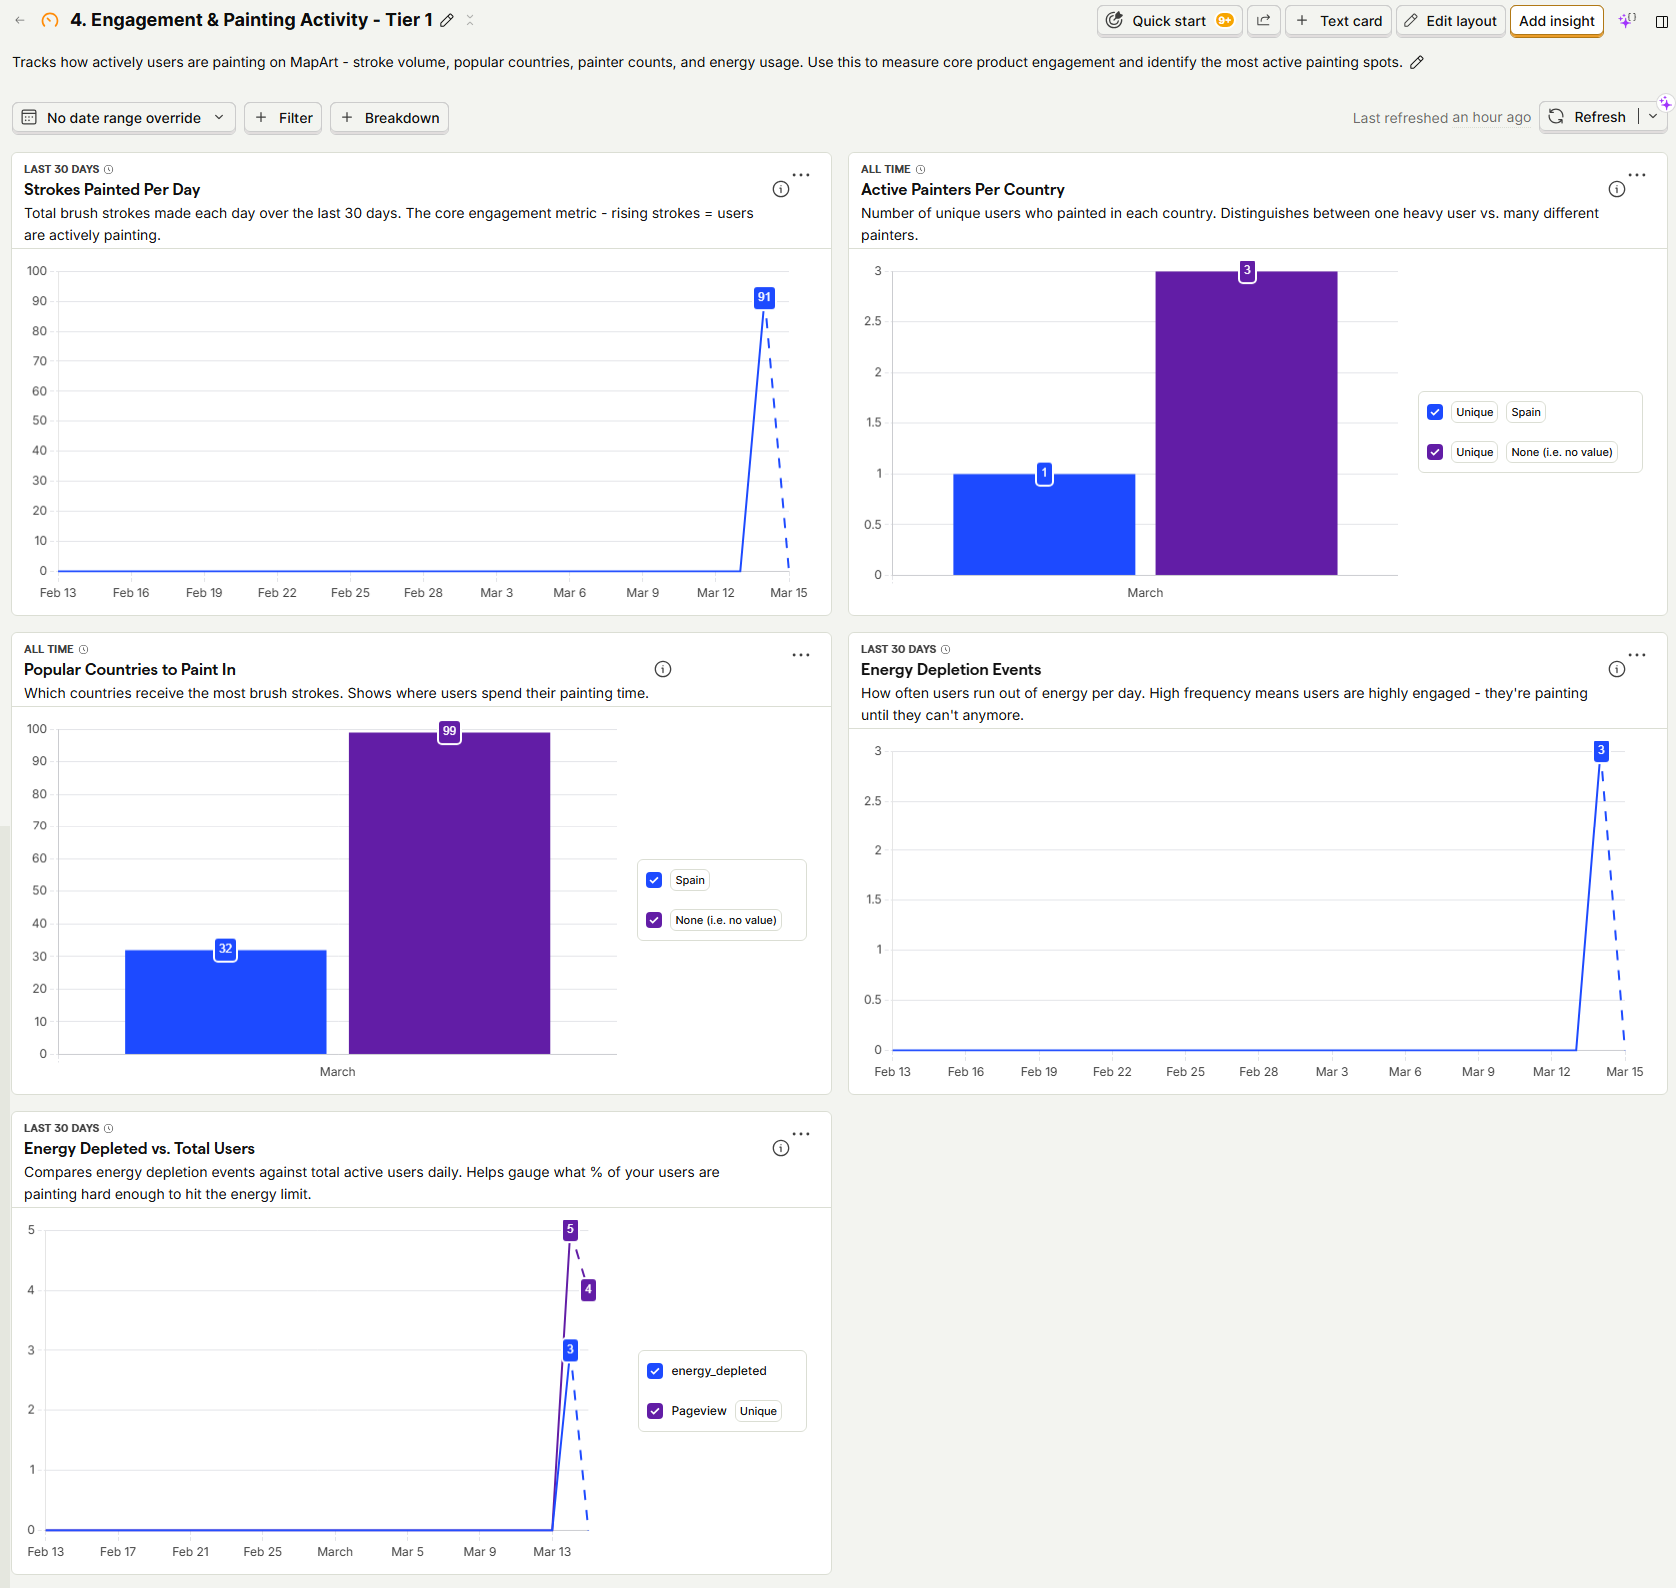
The PostHog analytics stack was instrumented before the MVP build, so data collection has been live from day one. I designed a custom event schema upfront rather than retrofitting later - two core events capture the full engagement picture, each with rich contextual properties that map directly to dashboard breakdowns.
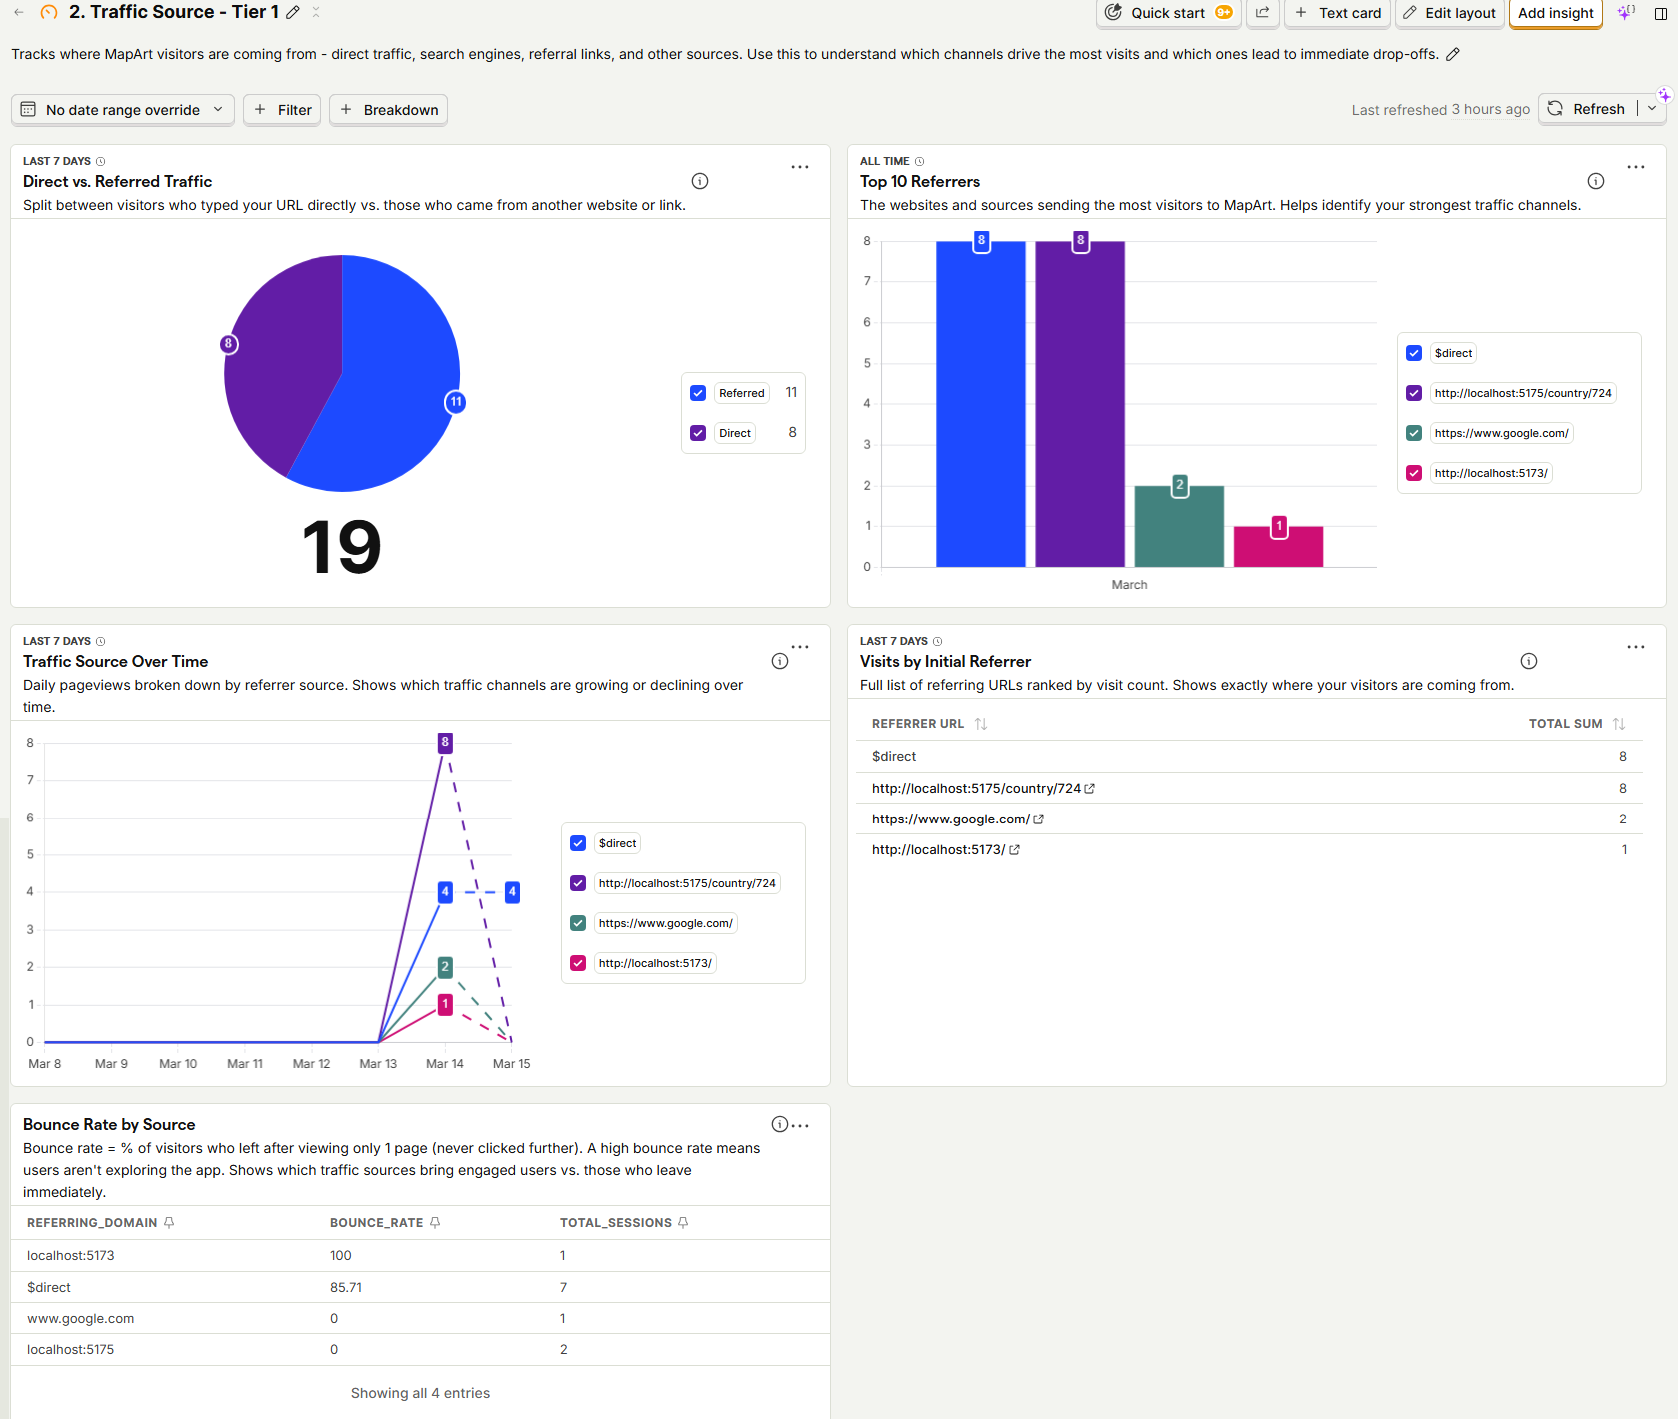
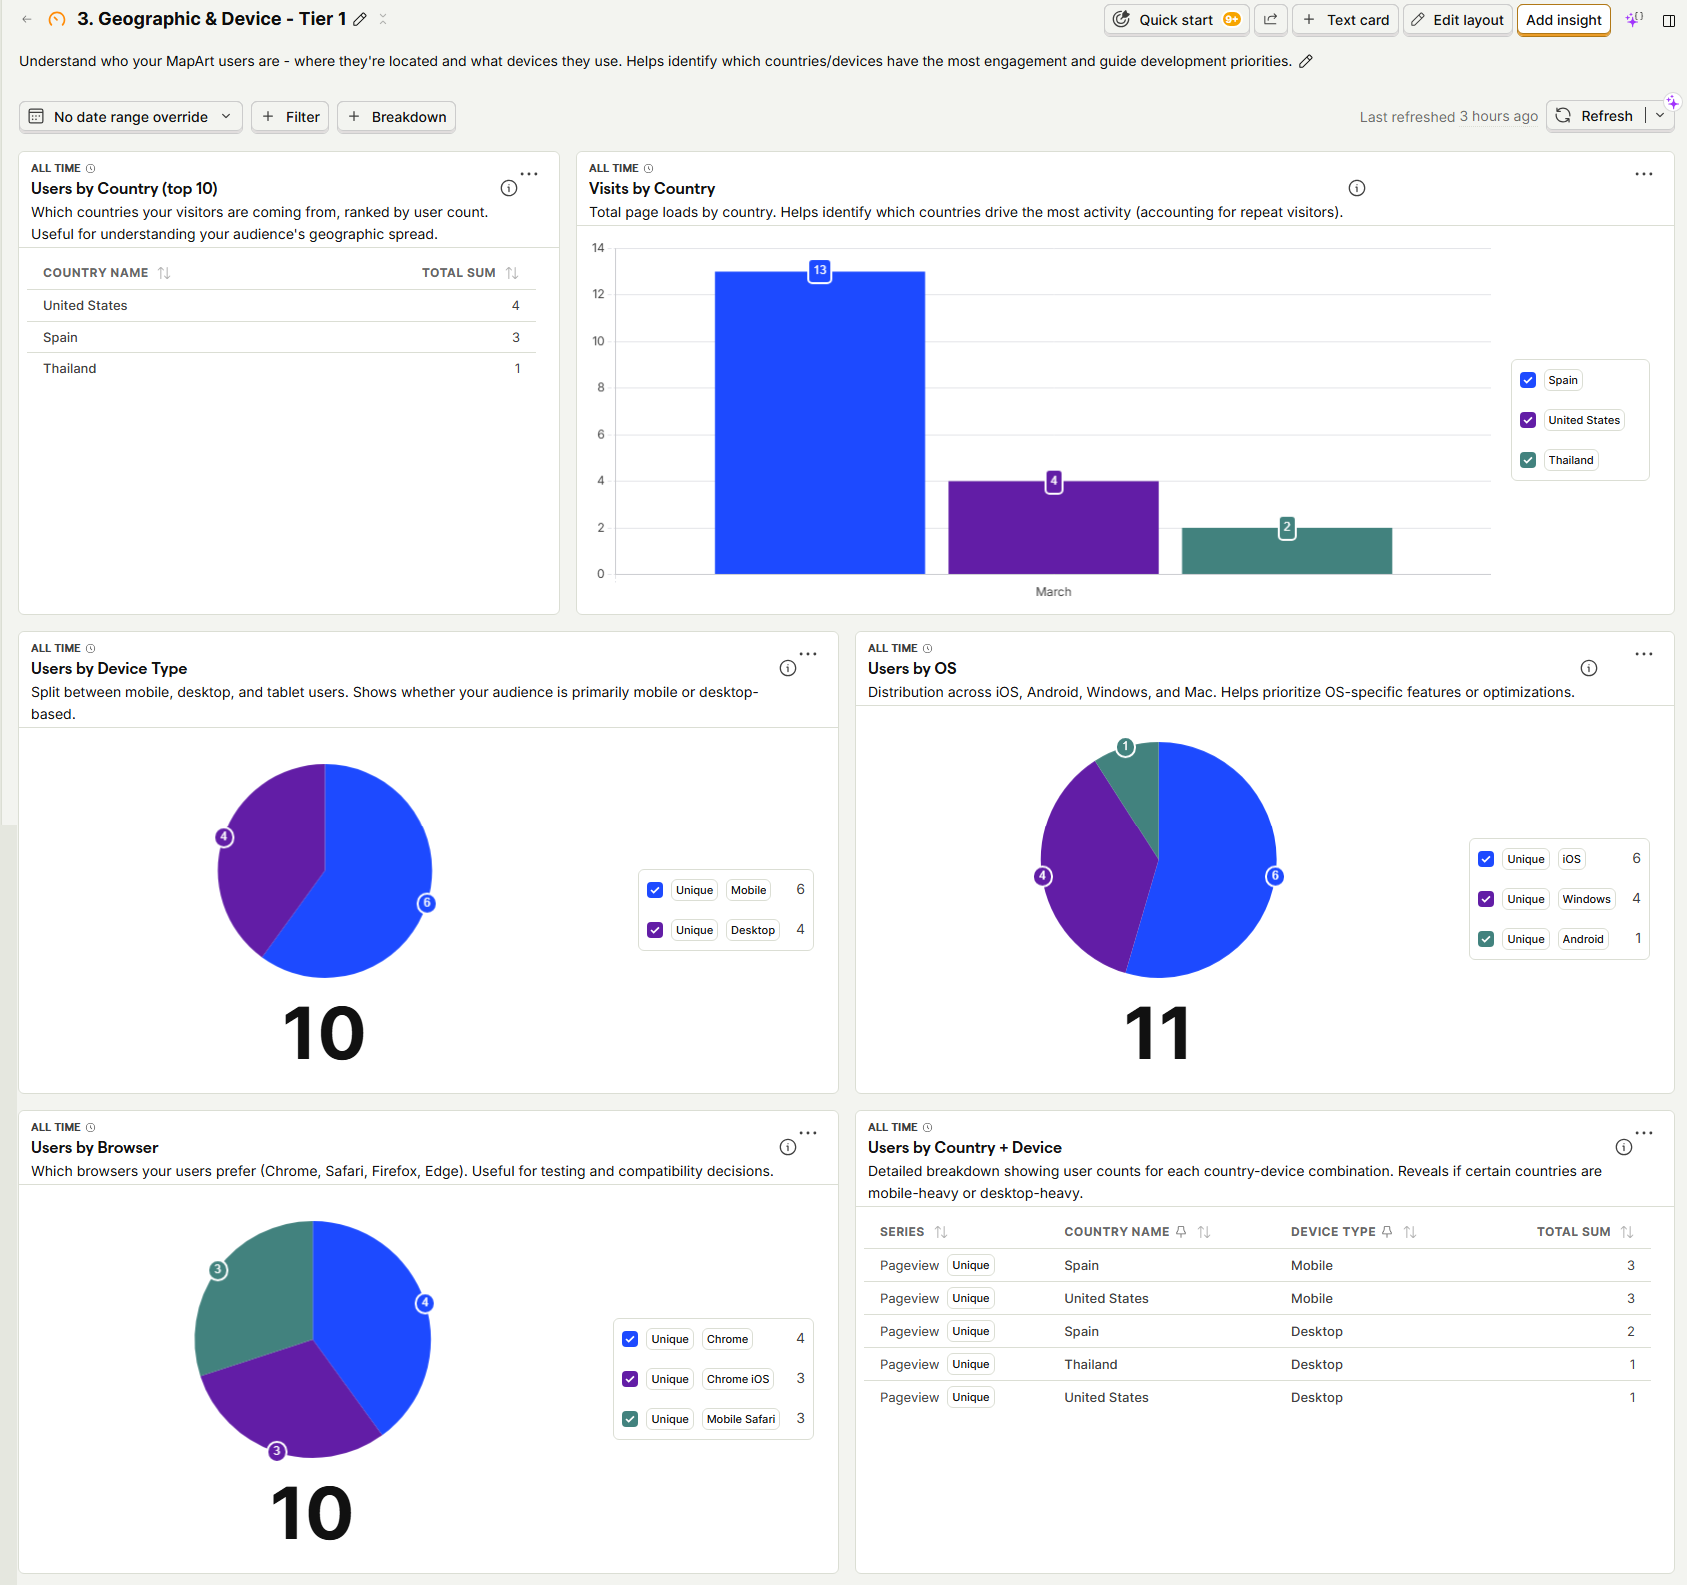
Four dashboards with 22+ insight cards cover user acquisition, traffic sources, geographic and device breakdown, and engagement metrics (strokes per session, energy depletion rate, session duration, top countries and players).
Tools Used
React, TypeScript, Vite, Node.js, Express, Socket.io, MapLibre GL JS, HTML5 Canvas, PostgreSQL (Supabase), Redis (Upstash), Cloudflare R2, PostHog, Vercel, Railway, Linear
Get Started
Looking to Hire?
I bring 19+ years of cross-functional experience to every role. Connect on LinkedIn to learn more.
Need a Consultant?
Whether it's a short sprint or a long-term engagement, I'm ready to help your team deliver better results.