Rize.gg MLBB Dashboard
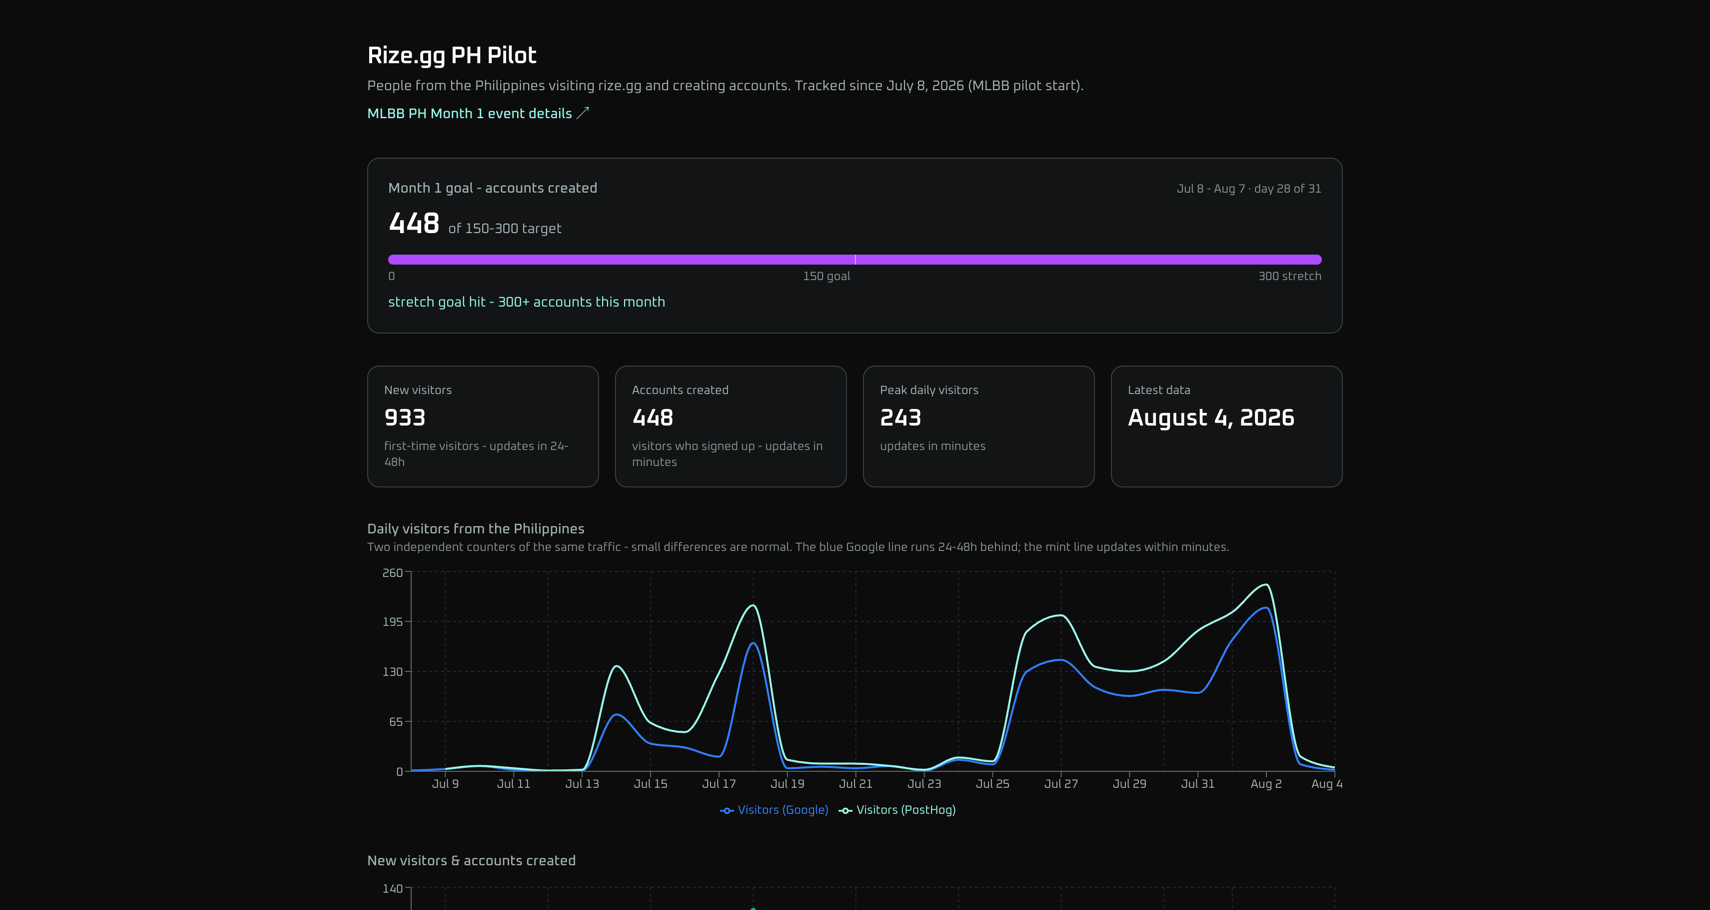
One live web page where the rize.gg team watched how their Philippines gaming tournaments were doing: visitors, signups, and progress toward the monthly goal, updated within minutes.
Client: Rize.gg
Project Details
When Rize.gg, a platform for finding gaming teammates, piloted its Philippines entry with weekly Mobile Legends: Bang Bang tournaments, the whole month came down to one number: would 150 to 300 people create accounts? I built the live dashboard the team watched it on, a single page that queries Google Analytics and PostHog directly, refreshes within minutes, and runs on no database at all. The pilot closed at 461 accounts, 54% past the stretch goal, and nobody ever had to compile a report to know it.
Challenge
A pilot only teaches you something if you can tell whether it is working while it runs. This one had a hard target and a four-week clock, and the evidence lived in the wrong places.
- The truth was split across two tools. Philippines traffic sat in Google Analytics, which lags 24 to 48 hours; account signups sat in PostHog, which is near-real-time. The two counters never quite match, and neither tool is readable for someone who does not live in analytics.
- The audience was not technical. The person running the tournaments needed to check pace mid-event, often on a phone, and see "visitors" and "accounts created", not sessions, events, and HogQL.
- Pace mattered daily. With a 150-300 goal for month one, the team needed to know each morning whether the last tournament moved the number, not find out in a month-end report.
- A pilot cannot carry infrastructure. A short experiment does not justify a database, sync jobs, and a reporting pipeline that someone has to babysit after the month ends.
Approach
Build it for the person reading it
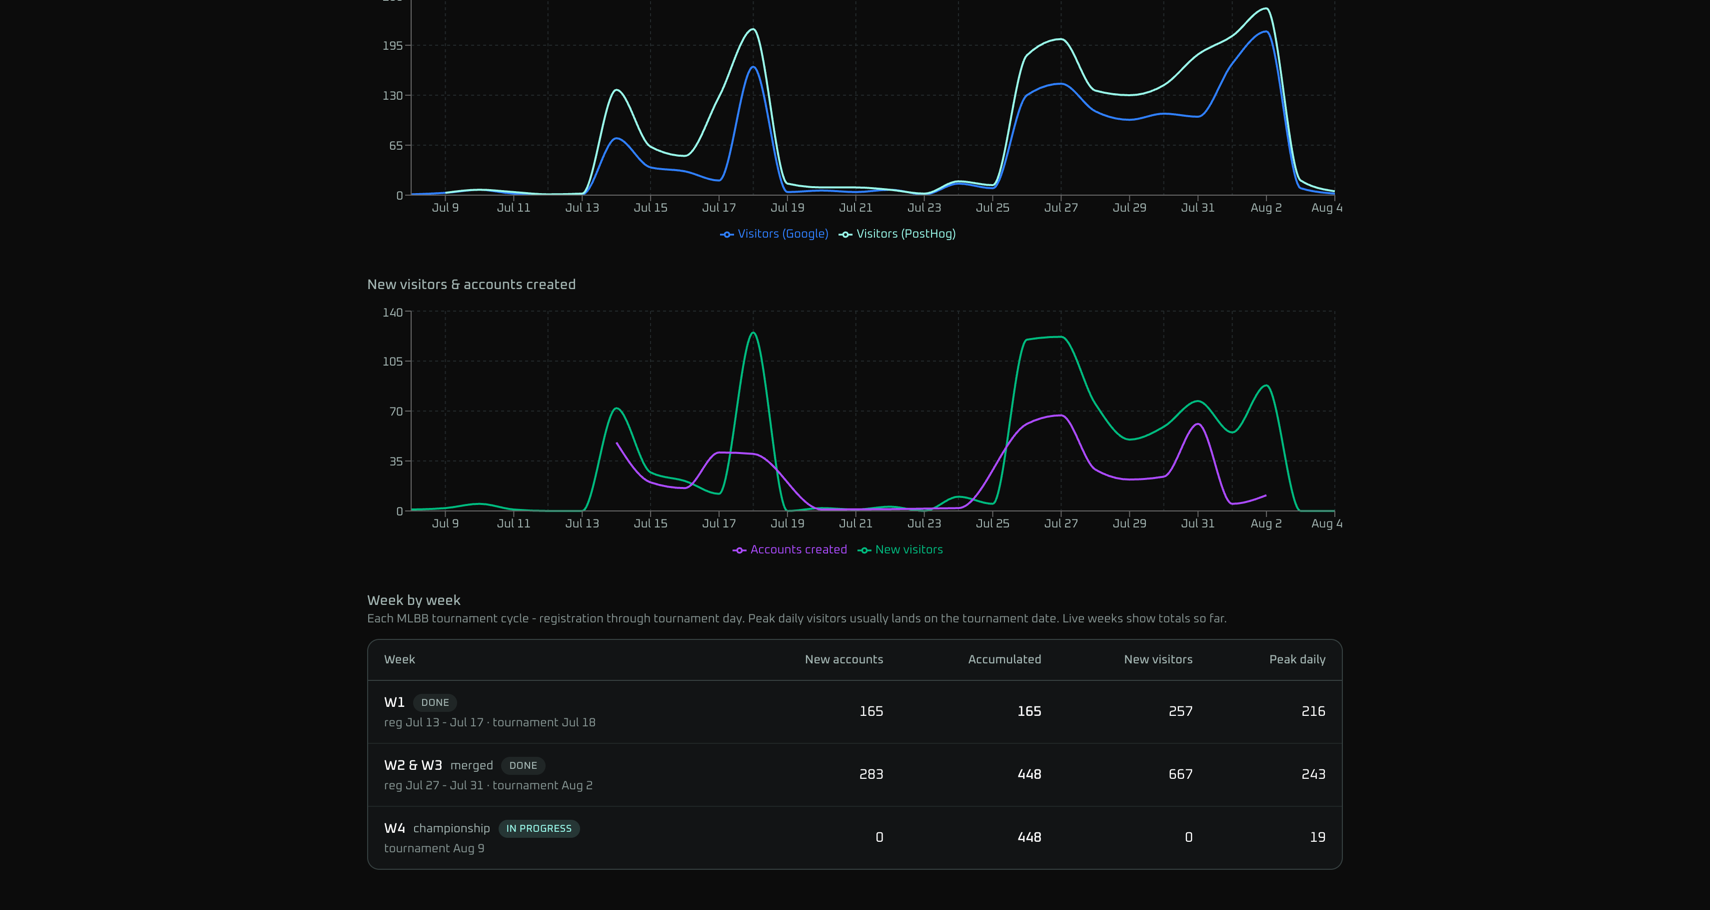
Everything on the page answers a question the pilot team actually asks. A goal bar shows live month-1 progress against the 150-300 target with the stretch goal marked. Four cards give the headline numbers in plain words, each labeled with how fresh it is. A week-by-week table mirrors how the pilot actually runs, registration days through tournament day, so each MLBB cycle reads as its own row with accounts, visitors, and peak day. The whole page wears rize.gg's identity, near-black background, mint accents, the Oxanium font, and holds up on a phone, because that is where it gets checked mid-tournament.
Two counters, shown honestly
Instead of pretending there is one true visitor number, the daily chart plots Google Analytics and PostHog side by side and says exactly why they differ: one runs a day or two behind, the other updates in minutes, and small gaps are normal. That honesty is what let a non-technical team trust the page instead of questioning it every time two numbers disagreed.
No database, no middle layer
The first version had a Supabase store and a nightly n8n sync. I deleted both. The Next.js server now queries the Google Analytics Data API, filtered to the Philippines through a service account, and PostHog's query API in HogQL, live on every page load. There is nothing to sync, nothing to go stale, and nothing to maintain when the pilot ends. Each source fails independently, so a broken key shows a small notice while the other series keeps rendering, and with no keys configured the page renders sample data so the UI could be reviewed before go-live. A basic-auth gate sits in front when credentials are set.
Results
Final numbers for the pilot month, July 8 to August 9, 2026.
- The pilot finished 54% past its stretch goal in plain view. 461 accounts created against a goal of 150 to 300, with 1,021 new visitors from the Philippines since launch and a peak of 243 in a single day, and the whole team watched it happen on the same page.
- The tournament rhythm became visible. Each weekly cycle shows as a spike that lands on tournament day: week 1 brought 165 accounts, the merged week 2-3 cycle added 283, and the week 4 championship closed it out at 461, so the team can see which events pull and plan the next market entry accordingly.
- Reporting effort went to zero. Nobody exports, merges, or formats anything. Opening the page is the report, and the signup numbers on it are minutes old.
- Nothing to babysit. No database, no sync jobs, no pipeline. Two API keys and a Vercel deploy, and if one source breaks the other still renders.
Tools Used
Next.js, React, Recharts, Tailwind CSS, Google Analytics 4 Data API, PostHog Query API (HogQL), Vercel
Get Started
Looking to Hire?
I bring 19+ years of cross-functional experience to every role. Connect on LinkedIn to learn more.
Need a Consultant?
Whether it's a short sprint or a long-term engagement, I'm ready to help your team deliver better results.