MapArt: Collaborative Real-Time Painting Web App
Client: MapArt (Personal Venture)
Project Details
I co-founded MapArt to build a collaborative real-time painting game anchored to an interactive world map, targeting Gen Z and Gen Alpha players who want short, creative, and competitive sessions. As co-founder and lead developer, I own the full product lifecycle: product vision, architecture, analytics implementation, and development.
Overview
MapArt is a collaborative real-time painting app where players claim and paint on canvases anchored to countries on an interactive world map. Players use brushes to leave their mark on any country, competing for territory and recognition through a gamified energy and progression system, complete with leaderboards, levels, and a shared creative meta-game.
The concept targets Gen Z and Gen Alpha: short-session, creative, competitive, and social. MapArt sits in the same space as r/place and wplace.live, but with a geographic twist - every canvas is a country, and every stroke is a statement.
My Role
I am co-founder, lead developer, and product lead on MapArt. My scope covers the full product lifecycle: defining the product vision, making architecture and infrastructure decisions, managing the project, implementing the analytics stack, and leading development.
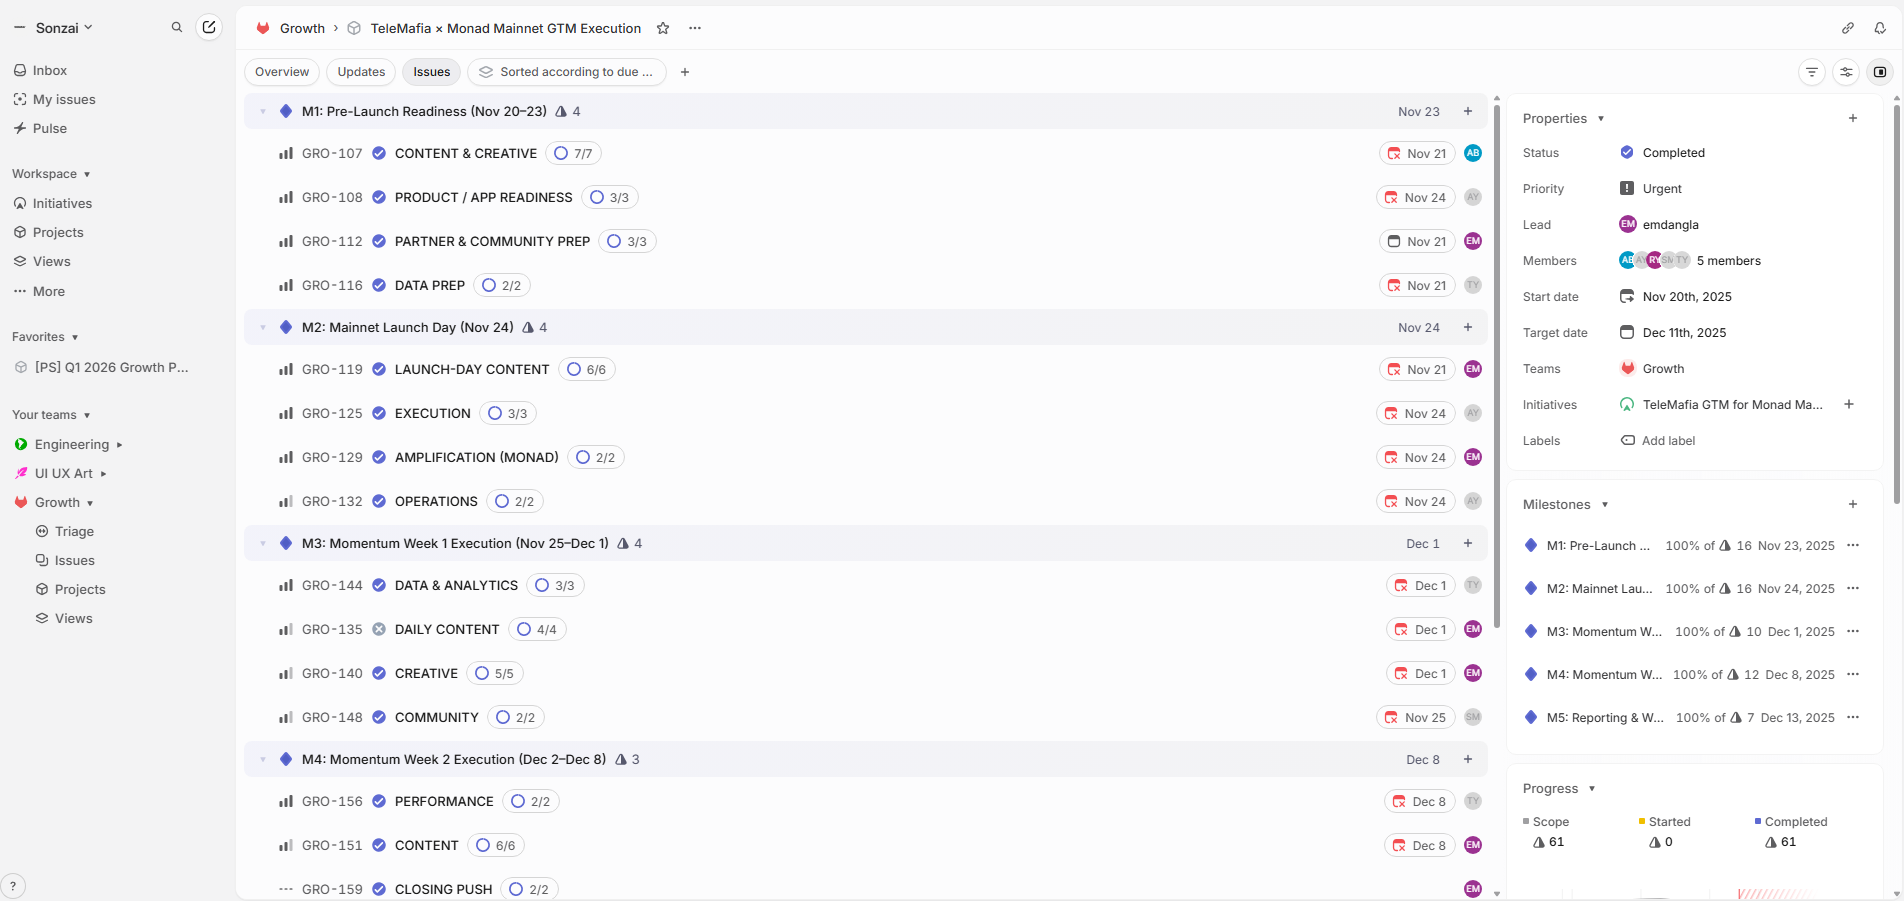
Product & Planning
Before writing a line of application code, I defined the MVP scope and the product metrics that would tell us whether we were building the right thing.
The MVP is structured as two phases: a core engagement loop (map, painting, energy system, auth), followed by social and competitive mechanics (leaderboards, progression, polish).
I defined target success metrics before building, covering day-one retention, strokes per session, and average session duration. These became the direct basis for the analytics dashboards I built in PostHog.
The post-MVP roadmap includes guilds, faction-based territory control, paint battles, in-game currency, and creator tools.
What I Built
Architecture
The stack is purpose-built for real-time, multi-user state. The frontend is a React + TypeScript single-page app deployed on a global CDN. The backend is a persistent Node.js server handling WebSocket connections. Data is split across a relational database for persistent state, an in-memory store for active session data, and object storage for canvas snapshots. Auth uses OAuth 2.0 with bot protection.
Every infrastructure choice was driven by one of three constraints: WebSocket compatibility, egress cost, or latency for the target user base.
Core Product Features
- Interactive world map - clicking any country opens its canvas, rendered from the latest saved snapshot.
- Real-time brush painting - all users in a country room see each other's strokes live over WebSockets.
- Energy and progression system - each player has an energy pool that regenerates over time. Painting spends energy; levelling up increases capacity.
- Leaderboards with time filters, driving competition at both individual and national levels.
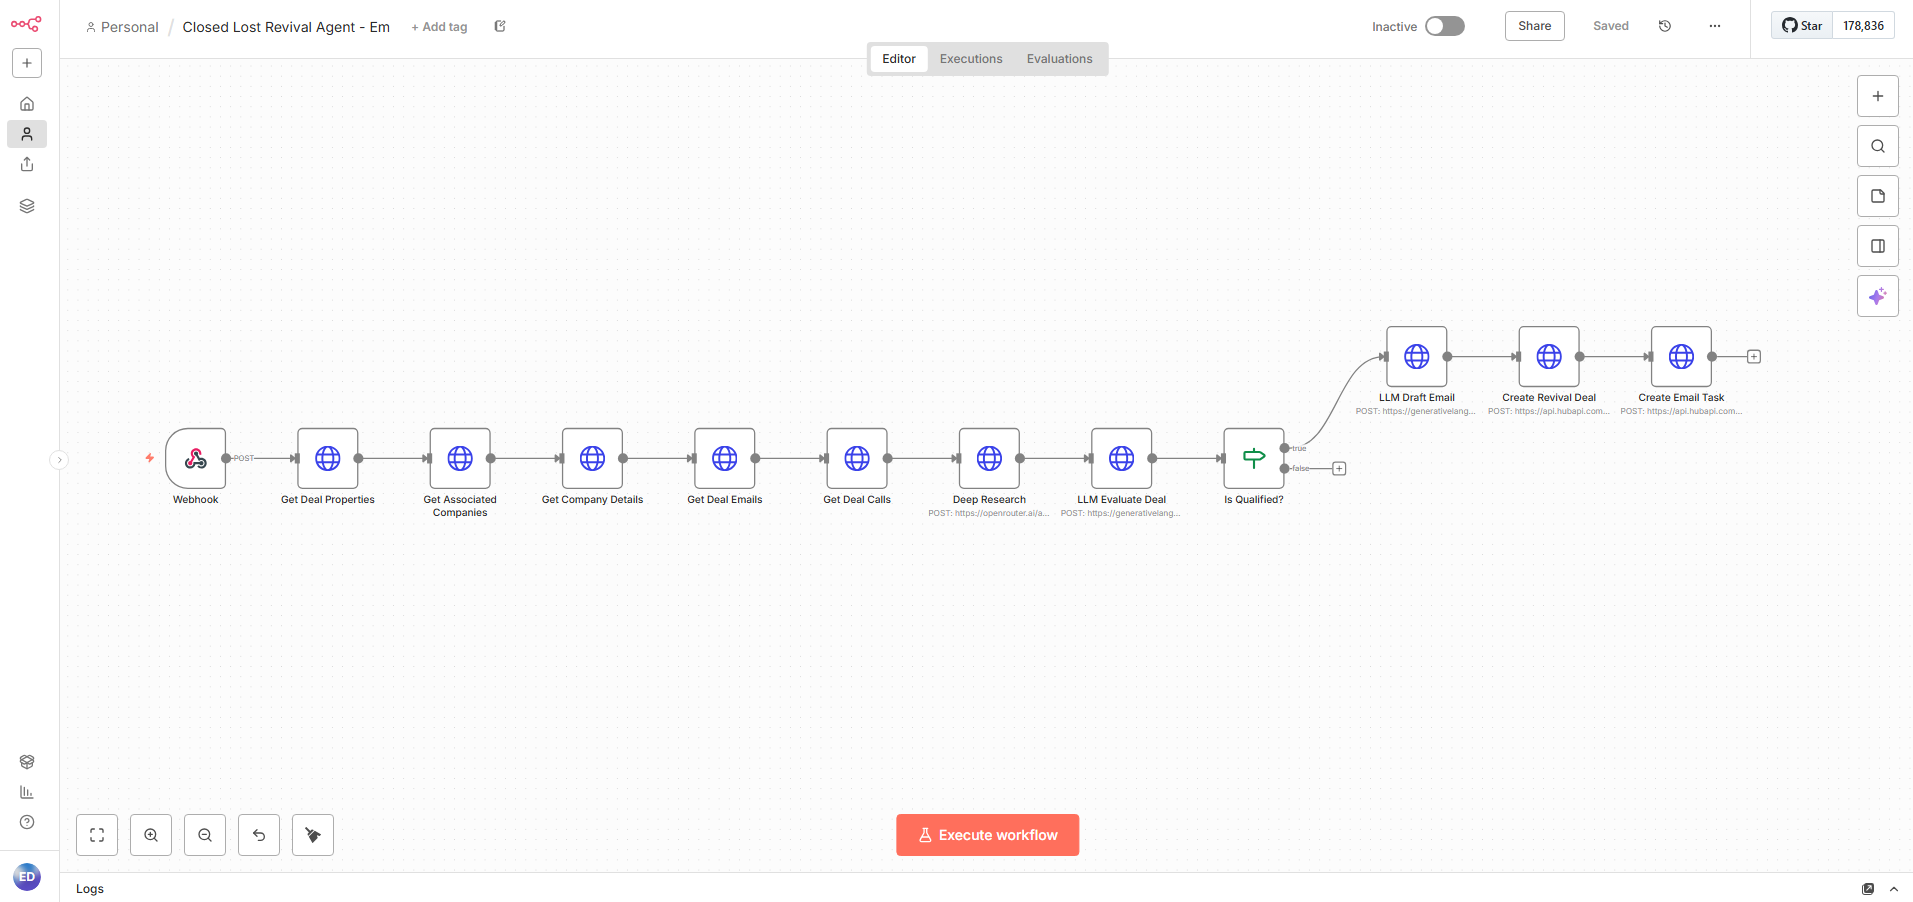
Analytics Implementation (PostHog)
The PostHog analytics stack was implemented before the MVP build started so data collection is live from day one.
I designed a custom event schema with rich properties upfront, rather than tracking minimal data and re-instrumenting later. Two core events capture the full engagement picture: one fires on each brush stroke with contextual properties (country, brush settings, energy state, player level), and one fires when a player's energy runs out.
This schema was designed with the dashboards in mind: every insight I wanted to build had a corresponding property ready to break down on.
Dashboards
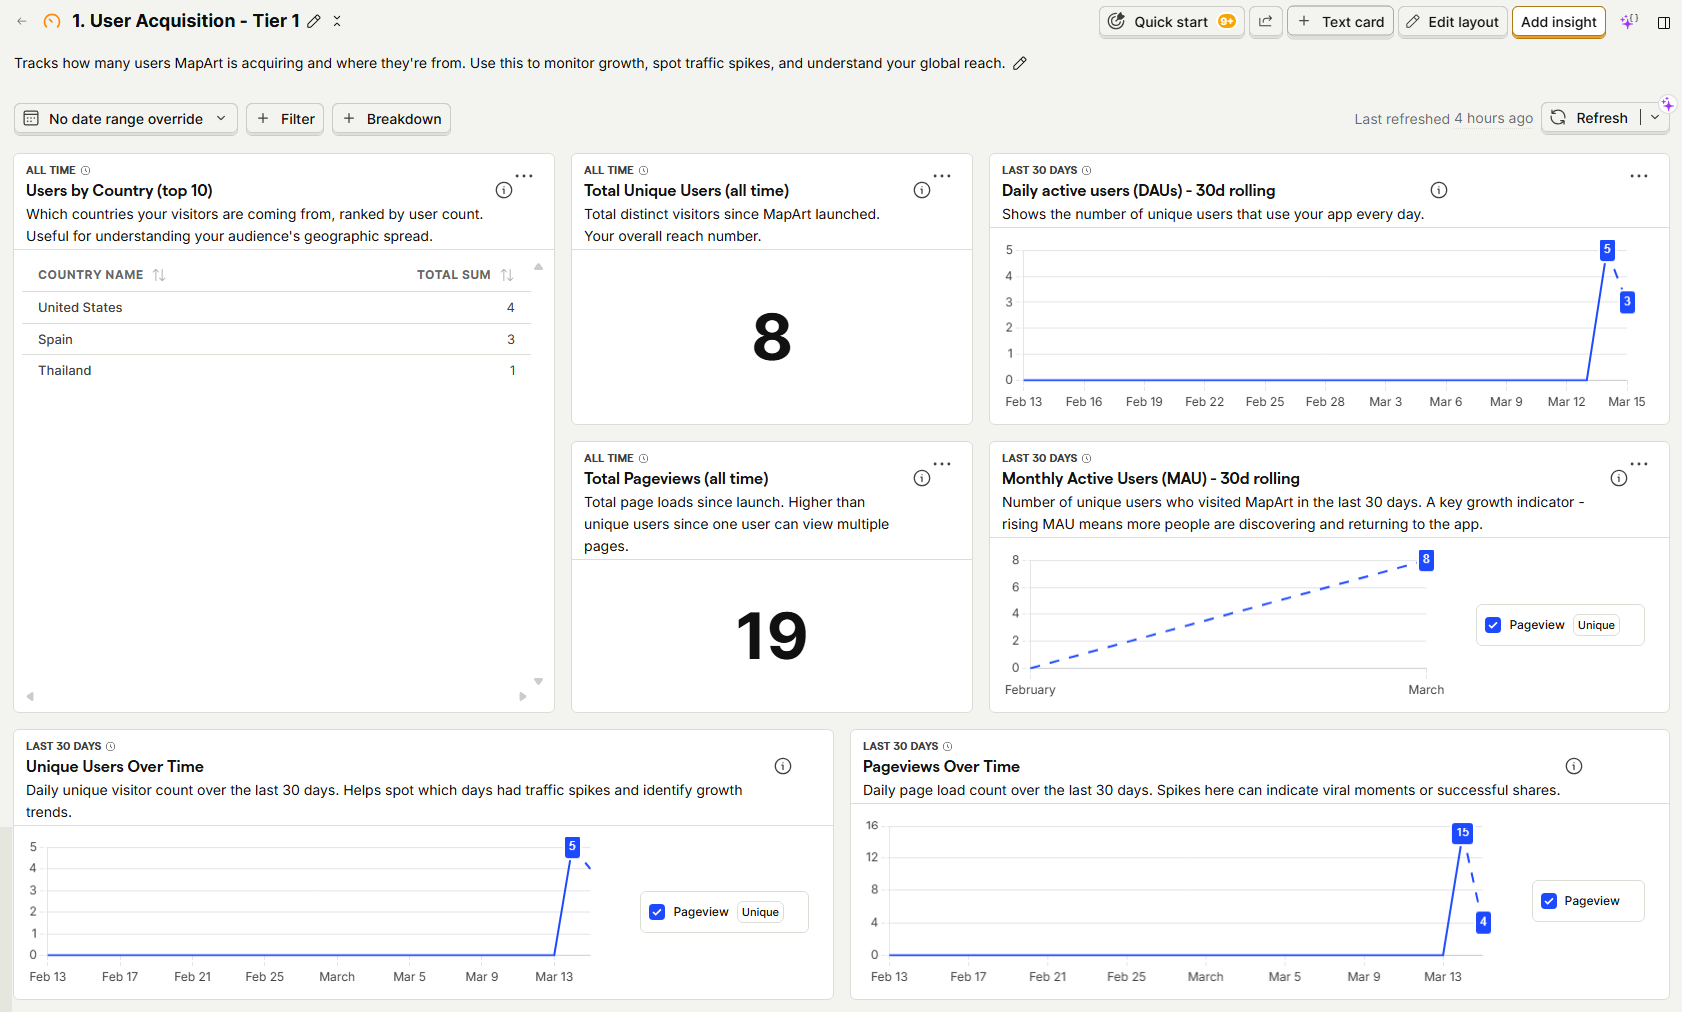
4 Tier 1 dashboards with 22+ insight cards total:
- User Acquisition - new users, sign-ups, returning users, activation funnel
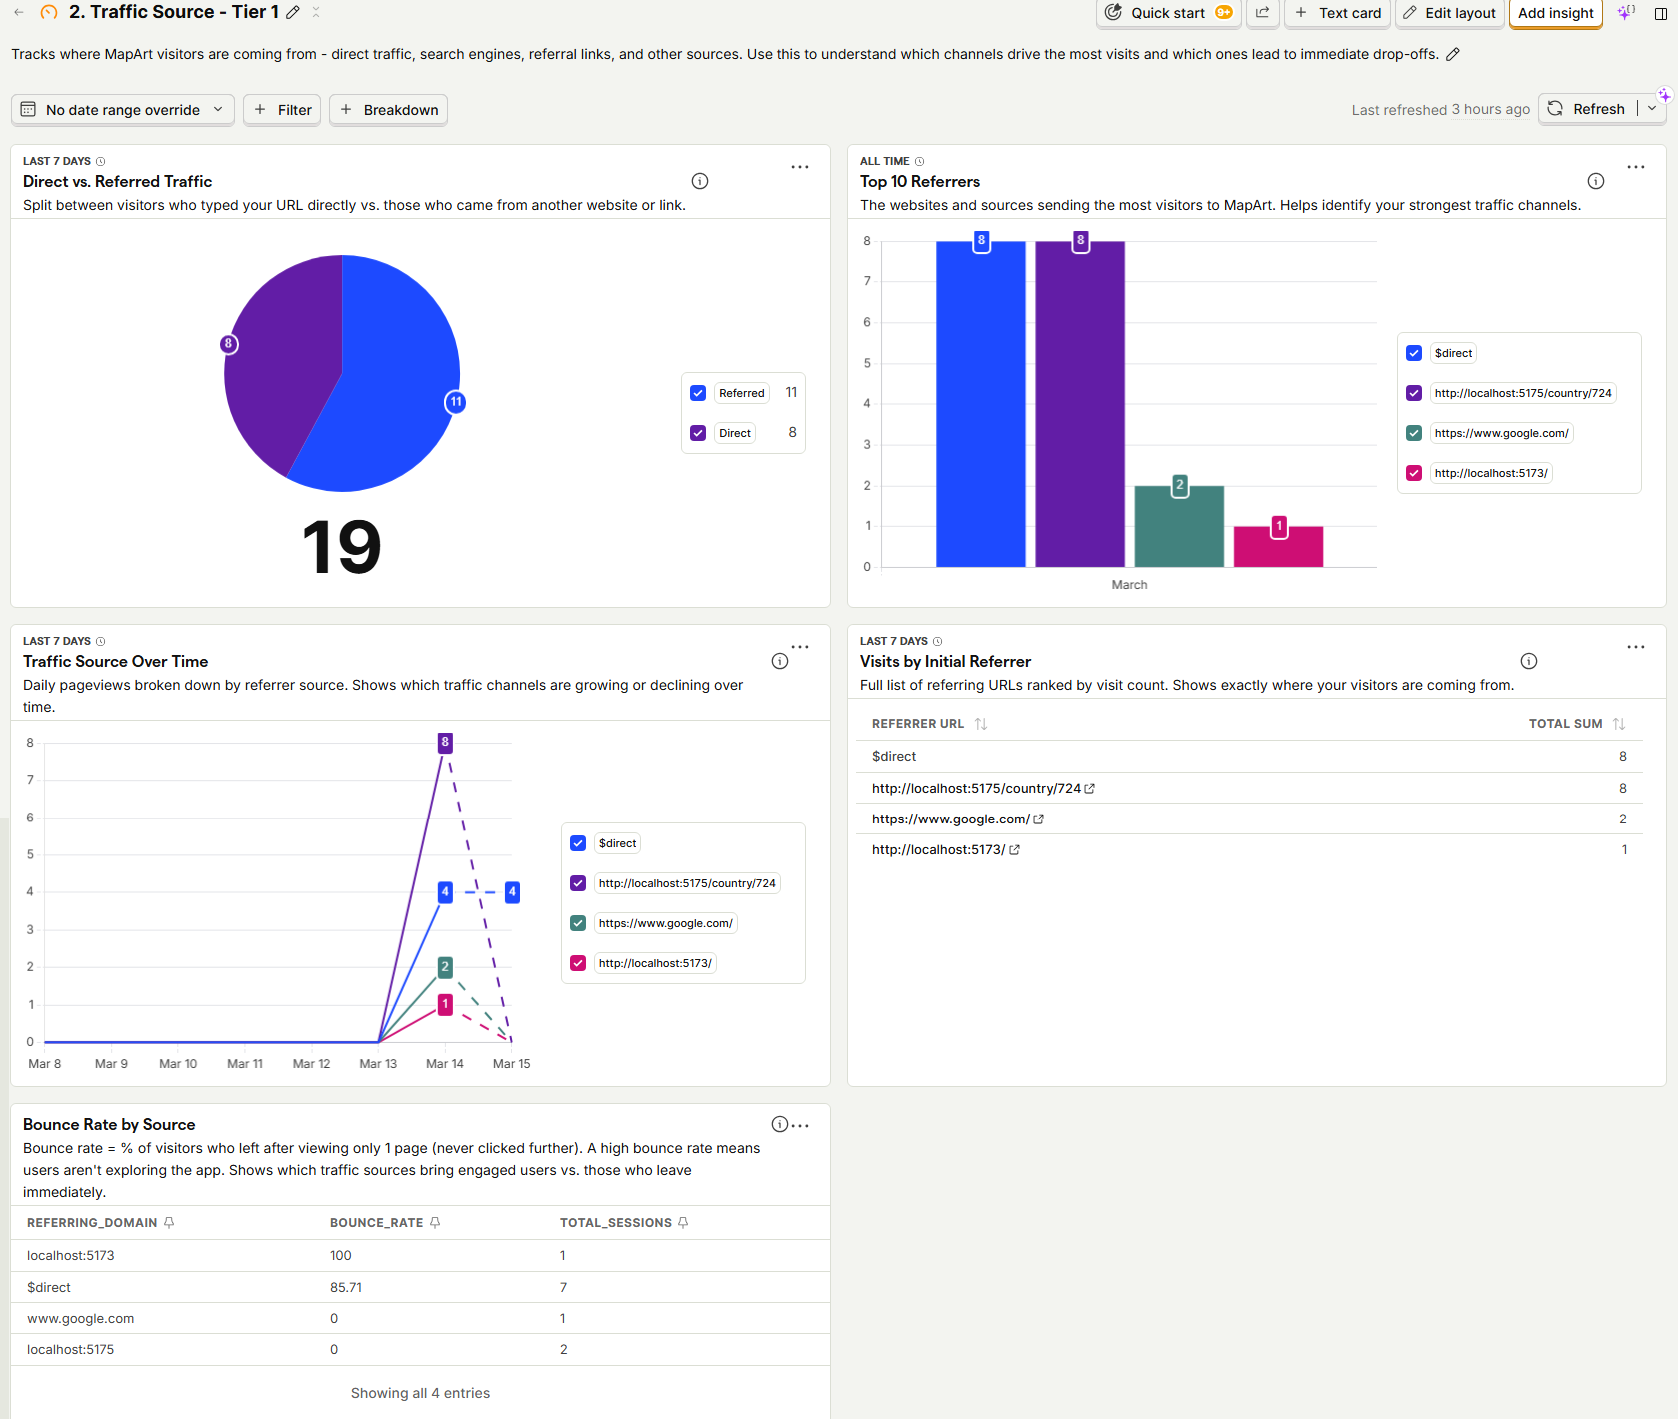
- Traffic Source - referrer breakdown, direct vs. referred, bounce rate by source
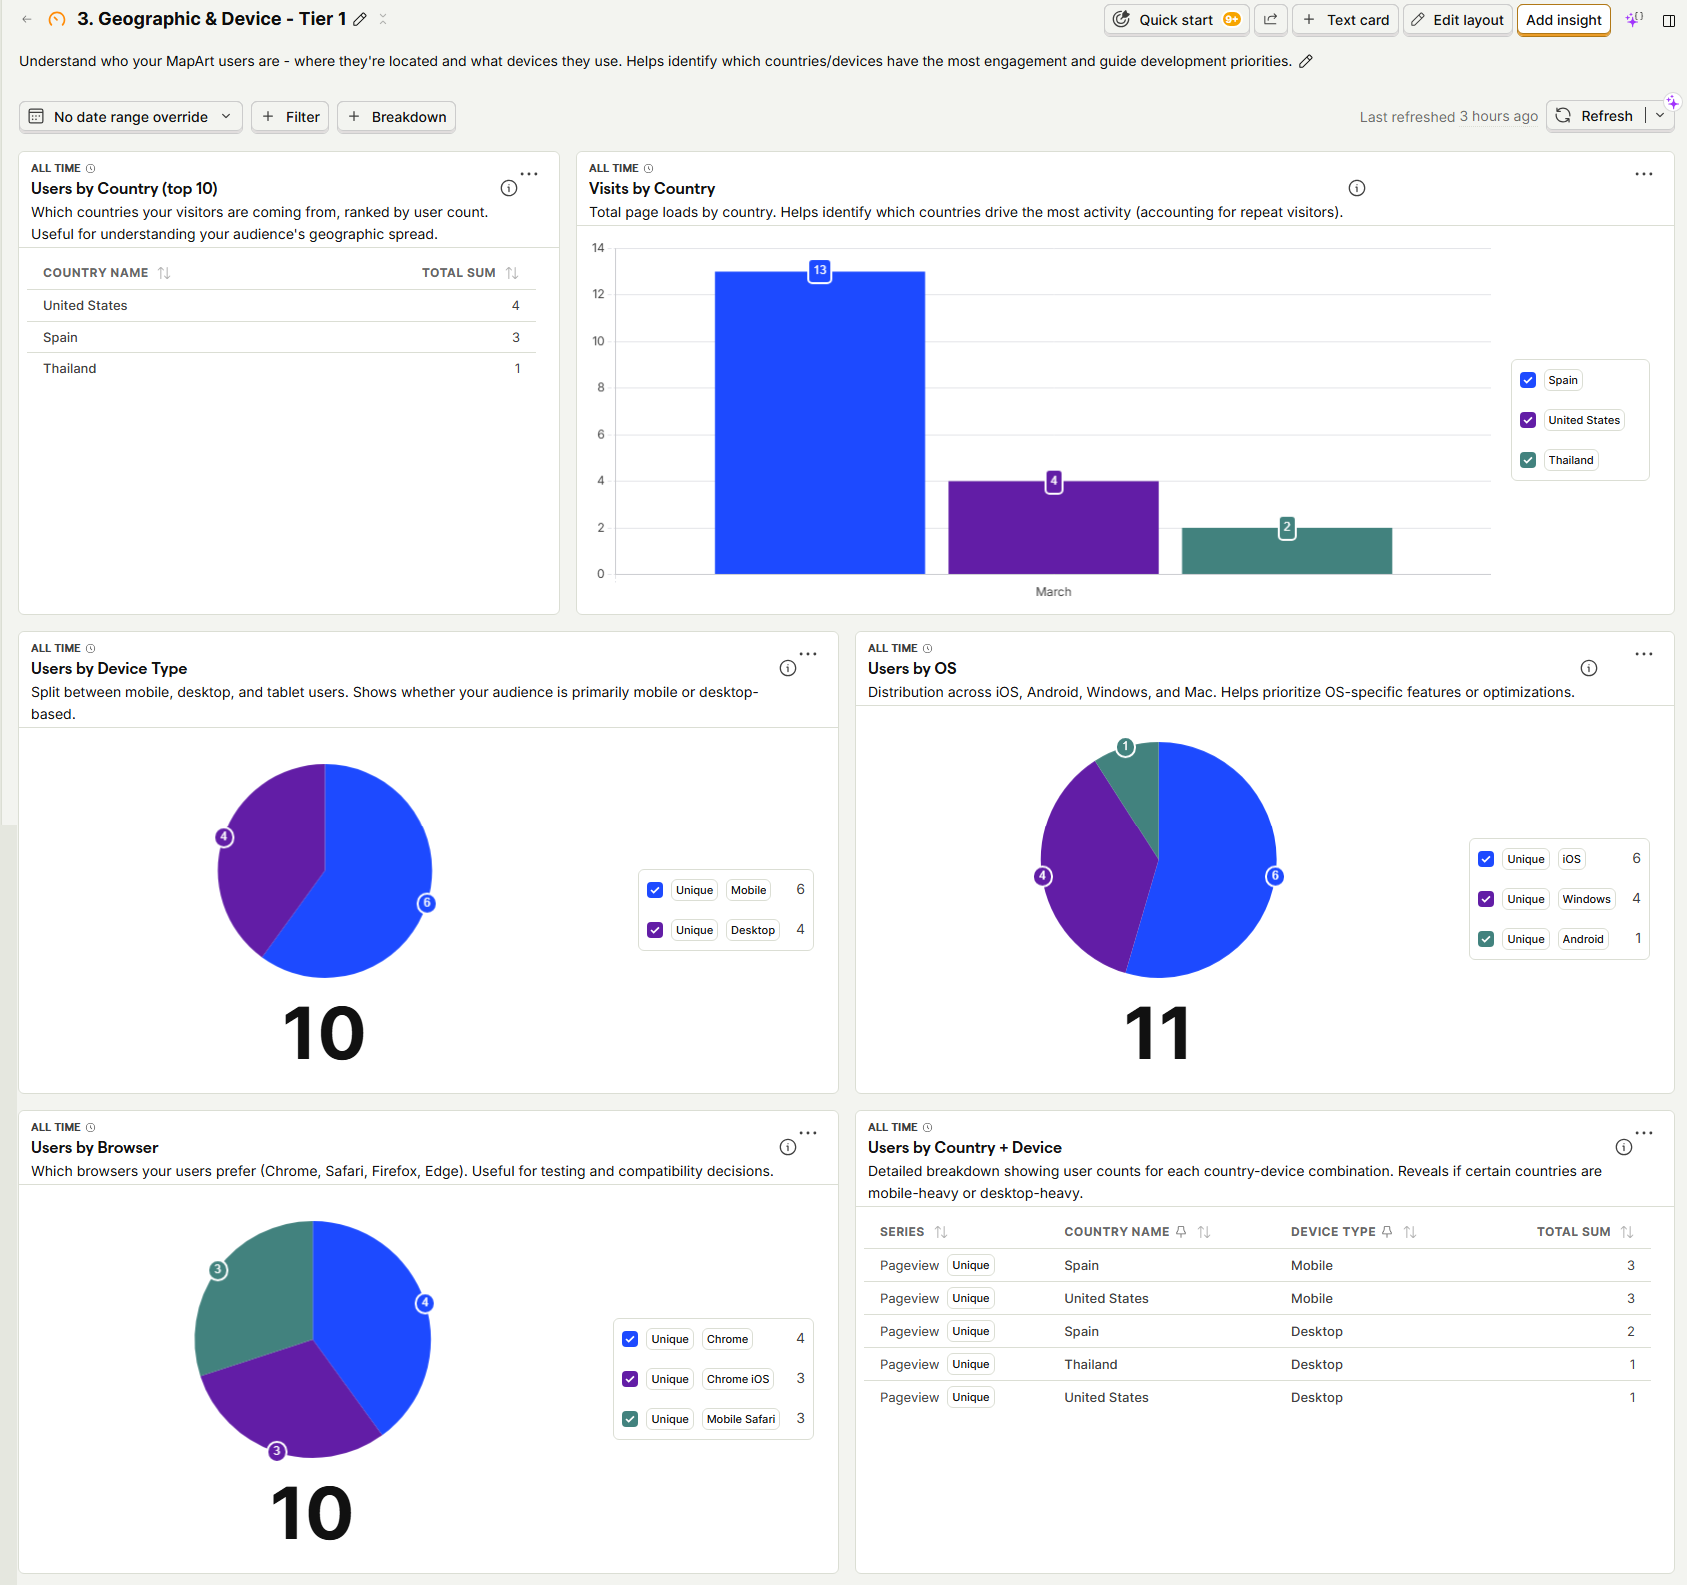
- Geographic & Device - country of origin, device type, browser, OS
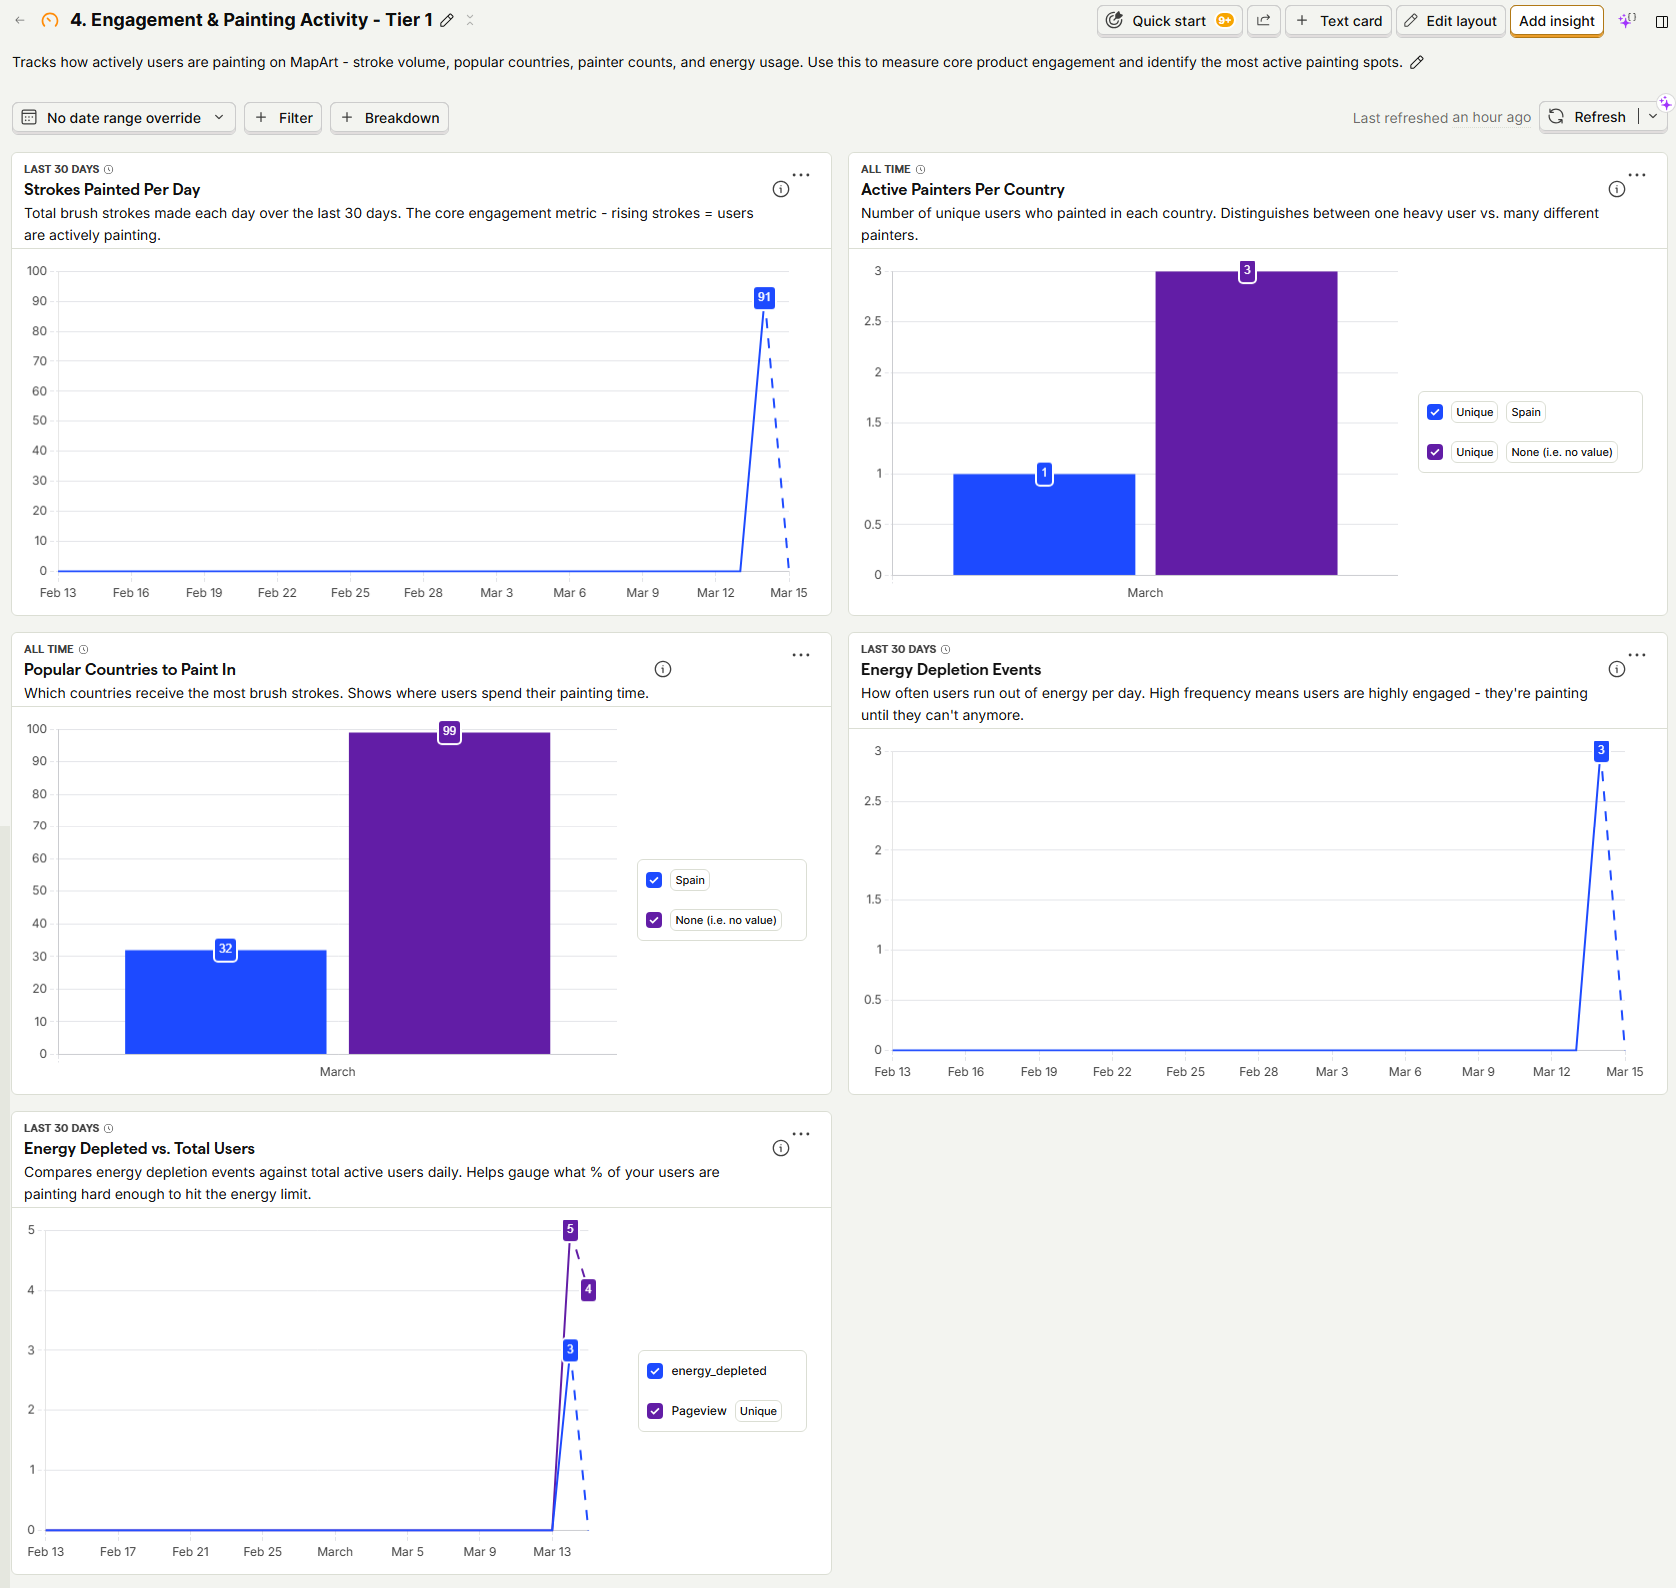
- Engagement - strokes per session, energy depletion rate, session duration, top countries and players
The bounce rate by traffic source insight required a custom HogQL query (ClickHouse SQL dialect) using session-level aggregation, as it is not available as a native PostHog breakdown.
Tools Used
React, TypeScript, Vite, Node.js, Socket.io, MapLibre GL JS, HTML5 Canvas, PostgreSQL, Redis, PostHog, Vercel, Railway, Linear
Get Started
Looking to Hire?
I bring 15+ years of cross-functional experience to every role. Connect on LinkedIn to learn more.
Need a Consultant?
Whether it's a short sprint or a long-term engagement, I'm ready to help your team deliver better results.